Negative slope
Fatima and the Disappearing Snow
|
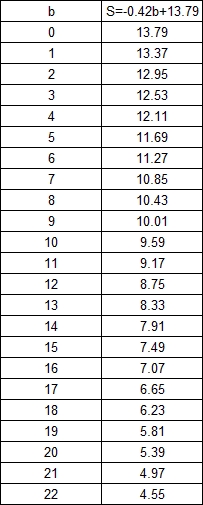
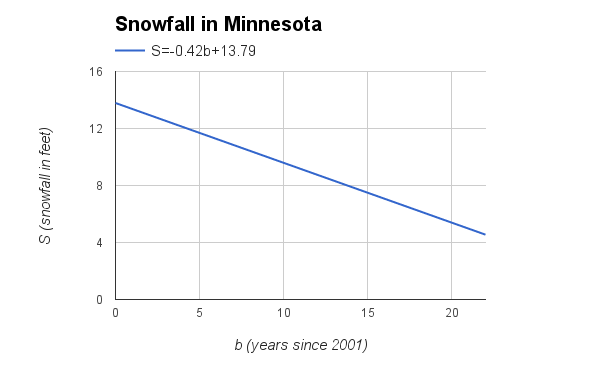
Fatima lives in Minnesota. It is near the Canadian border so it snows there a lot. She noticed the amount of snowfall in Minnesota has decreased yearly since 2001, the year she was born (b equals the years since 2001). In 2001 it snowed 13.79 feet. In 2013 it snowed 8.75 feet. In 2014 it snowed 8.33 feet. (Let S represent the amount of snowfall in a year.)
a.)Assuming a constant rate of change, find the slope of the equation. b.) Find S(5) and explain what it means in the context of this problem. c.) How much will it snow in 2020? d.) What year will it snow less than 5 feet? (Round to the nearest year). |

Photo Credit: Pixbay
|
Solution
a.) Find the slope of the equation.
The slope, -0.42, is the decrease in feet in the amount of snow in Minnesota every year.
b.) Find S(5) and explain what it means in the context of this problem.

S(5) is the amount of snowfall on the year Fatima was 5 years old, 2006. The amount of snowfall that year was 11.69 feet.
c.) How much will it snow in 2020? To find this first count the number of years between 2020 and Fatima's birth. That amounts to 19 years. So to solve for the amount of snowfall in 2020 substitute S(19) into the equation.
c.) How much will it snow in 2020? To find this first count the number of years between 2020 and Fatima's birth. That amounts to 19 years. So to solve for the amount of snowfall in 2020 substitute S(19) into the equation.
The amount of snowfall in 2020 will be 5.81 feet.
d.) What year will it snow less than 5 feet? (Round to the nearest year).
It will snow less than 5 feet approximately 21 years after Fatima was born, 2022, and every year after that.
Equation, Table, and Graph

|
|
Reflection
This example is about negative slope. Slope is a graph’s change in the x and y-coordinates and is expressed as the value “m” in the equation y=mx +b. In this problem you are asked to solve for the slope of a line measuring the decrease of snowfall in Minnesota. To solve for slope you divide the change in the y-coordinates by the change in the x-coordinates. The slope of a line measures its change and also its steepness. The slope of a line can also be seen as the ratio of the x and y-coordinates. Once you solve for the slope you can predict the future values. In this equation snowfall, S, is expressed as a value of time, b, the years since Fatima was born. The example gives you the base, b, in the formula y=mx+b, which is the y-coordinate. In this problem that stands for the amount of snowfall on the year Fatima was born. With the base value and the slope you can solve for any coordinates on the graph of the equation. If you have the x value you can plug it in and solve for y and inversely if you have the y value you can solve for x. The different parts of this problem ask you to do that. The problem also asks you to use common sense and explain what the values mean in real life, so you can apply these problem solving skills onto real life problems you might face. If a problem applies to the real world you are more likely to understand it contextually and use it later on, outside of class. That’s why word problems are useful when using algebra. The data table allows you to visualize different values numerically and simultaneously. The graph allows you to visualize the values visually and as a data scatter plot (but since this is a slope problem there is no variation and it could be expressed as a straight line).
